App World
My stream
-
-
Our Top Applications are specifically chosen by our team to show you the “best of the best” out there in the wonderful world of cool mobile apps, including the best Iphone apps. While we also categorize by type – these are the apps that consistently linger at the top, are highly rated and are the most downloaded in the world! We have tried, tested and reviewed every single one. Whether it be everyone’s favorite sweet addiction Candy Crush saga, famous photo filter Instagram or videos-in-action Vine, we also try and include awesome top iphone apps and Android apps that you might have missed such as Skitch, a way to communicate visually or musiXmatch lyrics player – the number one lyrics app in the Itunes store. Or what about Shakechat? All you have to do is shake your phone and instantly chat with new friends. These apps are ones that you should have in your mobile device NOW so what are you waiting for? There are tons of must have iphone apps and android apps to choose from so start downloading them today!
-
Chatting has never become easier with the sheer volume of chat apps & social apps available in the mobile market. Perhaps you are looking to meet new people or even just connect with old friends, we have a great selection of social media apps (some famous - some less so) that we know you will enjoy. We have painstakingly went through app stores and personally selected, tested and reviewed only the best chat apps out there. Thinking of starting up a romantic relationship but consider yourself shy? Why not download Badoo, one of the most popular dating apps out there and start meeting new people.Looking for that perfect iphone chat app? Or discover cool app Shakechat! All you have to do is shake your phone and you can chat with new friends instantly! Not looking to meet new people but just remain close with family and friends? We recommend Path! Your private instant messaging. Connecting with people has never been so easy! There are many different options to choose from.
-
Apps can’t be all fun & games, sometimes you need useful apps in order to protect your precious information such as passwords, or your phone itself, which is why we created the Utilities category full of your best useful android apps and IOS apps.Here you will find tools all designed to help you better use your phone such as your hand Flashlight for Iphone, the best battery saver app for android,or even a Free Wifi finder to help you stay connected online anywhere in the world! Need some help organizing your financial life? Or what about finding the best weather app for android. Check out cool app LearnVest! Or for Android users - Swiss Army Knife app is full of cool tools such as flashlight, unit converter, stopwatch, timer, magnifying glass, ruler and all FREE to use or a Phone finder to track your mobile device if it gets lost or stolen. We have personally picked, tested and tried each of these apps and provided a personalized review. Start organizing your life and your phone today!
-
We all know how much everyone loves to shop and now with the internet - finding those great deals for good iphone apps has never been easier. Here we have lovingly collected, tried and tested all of our favorite shopping apps that you can use to find that perfect sale! We know you want only the best so of course you can find famous free favorites such as Ebay and Groupon here while we have also discovered cool phone apps you may didn’t even know existed! For example, the AT&T code scanner app scans UPC, QR and Data Matrix barcodes that you find on products, or find the best price comparison app! Or why not organize your next shopping trip with Shopping List app! So much shopping, so little time! You will find so many e-shopping based free apps to choose and stay tuned for updated ones added to the list. We love shopping!
-
Yoga apps, pilates apps, apps to control your carbs, exercise apps - best sports apps to help you stay in shape by letting you know which are the best sports-related apps on the mobile market. We wanted to find you guys only the very best, highly rated exercise apps available for FREE. We tried and tested each one and provided a personalized review. You can bet that sometime this was exhausting! You can track your runs and share them on your favorite social networks - same for cyclists with apps like Map My Ride! This app is full of the best iphone sports apps and free sports apps for sporting enthusiasts. What about finding a new yoga move – daily? Also keep in mind that these cool apps are all free and highly ranked. Get moving today, you now have no excuses to be lazy when you have these cool apps. We have provided you with many different sports apps free to choose from.
-
What would we do without the best photo-editing apps? No, but really! While we all snap photos on our mobile devices - what are the best photo apps out there? If you look online you will find almost too many choices out in the market and who knows if any of the apps are any good. This is why we have selected and tested many different options and here is our list of the best photo editing apps for editing and creating unique photos with an awesome photo collage app. Favorites such as Instagram and Adobe Photoshop made the list and lesser-known but just as fabulous apps Snapseed and Touch of Color, where you can insert color only where you want it! These two apps alone have changed our photo editing life and we think they will change yours too. Don’t get stuck behind the times! There are many cool photo apps here that you can choose from.
-
The way we travel has changed tremendously with the invention of travel apps, and we couldn’t be happier! We have searched and tested many apps to bring you this top list of the best travel apps. What are the best travel apps for iphone? We will discover them for you! This category allows you to check the best deals available out there on apps like Skyscanner, booking.com and access insider's tips to get the most out of your visit. Apps like WorldMate help you plan every aspect of your trip. Need to exchange money? Download a currency converter app! Find out what restaurants and bars are in your area with Yelp. There are so many different travel apps to choose from. You can even use a GPS based app in case you get lost so without a doubt, you will feel 100% ready for your next amazing adventure no matter where you are traveling to in the world. Bon Voyage and have fun!
-
We have listed here some of the best music apps available for your mobile phone. Everyone loves music and with all of the choices out there, it can be overwhelming. This is why we have personally chosen, tried and tested and reviewed what we have deemed the best music app for ios currently available. Love lyrics? Check out musiXmatch lyrics player, the number one music lyrics app in Itunes along with the Apple editors choice in over 44 countries! Why not try Deezer app to bring music to another level? Can’t remember that song on the radio? Shazam is the app you NEED to have to find the name of even the most obscure songs along with SoundHound. Tune into the world’s radio stations with the highly-rated app TuneIn Radio with 70,000 live radio stations and 2 million podcasts. Find out what your friends are listening to with cool app - Soundtracker. Listening to free music has never been so easy! Find out what are the best apps for music today!
-
Best apps to personalize your smartphone and customize your iphone. Our customized picks will ensure that you will have no pne will call your phone, ordinary! Download custom fonts with Font Maker or what about downloading Free App Icons to make each icon your own personal masterpiece! Why be like everyone else? With cool app Emoticans you can send any emotion via text, or messaging apps. Your friends will be impressed and beg to know what you have downloaded in order to customize their smartphones! Don’t forget Volume app boosters or a really cool Mood Pad. Why be happy with the default options that come with phone when you can add so much more! There are so many different apps here that we guarantee you won’t even know you want! We suggest trying our picks for your iphone customization for personalizations! We only list our own personal tried and tested favorites and have personally reviewed each one so that you have access to only the best customizable apps on the market!
-
Here you will discover the best free movie apps and tv movie apps available! We have searched all of the awesome apps catering to movies available in the mobile phone market and have tried & tested each of these apps, not mention given each one a personal review! Browse IMDB’s extensive database to discover details from your favorite films. Have a Netflix account? Get the official app to stream from your device! Check out free movie apps for IOS! Spend some time browsing famous Bollywood cinema trailers via a special app or download the ‘kayak’ of streaming services “Can I Stream It”. Or what about WikiTap, search anything in the wide Wikipedia database and find all sorts of cool videos related to the topic. We ensure that you are never left without plenty of fun videos to watch at any hour of the day! These are just a few of the apps that we have listed for you all so stay tuned!
-
Apps can also be used for educational purposes which is why we created this awesome category of free educational apps. Have you ever wanted to learn another language but have never found the right app for you that also happens to be free? Then you haven’t discovered our favorite free language app on the market – Duolingo! Skip Angry Birds and put learning to the test with our list of apps designed to make your brain work and help teach kids via interactive interfaces. We have personally picked each app and tried it in order to give you a personalized and very real review of the app. Plus we may have learned a thing or two along the way. There are numerous free apps for math and science, reading, language learning, quizzes and much much more. Why not embrace technology and make learning FUN! It has never been easier with these choices. Start downloading today.
-
-
-
We acknowledge the devastation over the Flappy bird's creator to shut down this popular game, in fact we admit that several of us at the Freapp offices might have shed a tear or two in the bathroom when we heard the news. Which is why we were inspired to create this list of awesome flappy bird replacement games that guarantee to make sure you get your fill of mind-numbing endless entertainment!
-
These are your best iphone games available in the mobile market. These are not only highly-rated apps but also the apps with the most downloaded ones from around the world. We have tried and tested each one in order to make sure they are still as great as they claim to be! Which top iphone games do we love? Of course you will find awesome favorites such as Candy Crush Saga, where you will surely find your sweet tooth or Angry Birds Free to launch your enemies into faraway lands! Too bad you can’t do that in real-life! Like to draw? Why not compete with players around the world with Draw Something or create worlds on the go with classic favorite, Minecraft game app. These top game apps are the best of the best so keep an eye out to lesser known but just as amazing ios games and android ones available free! We have plenty for you to choose from.
-
Not every game app is meant to be a difficult game of chess! Leave the stress at home with these top choices in the world of iphone casual games. We tried many free casual game apps and here is our top list of only the best ios casual games for you to choose from. Some of the ones we chose include, iSplume app, which lets you use loveable ‘splumes’ to complete easy to solve puzzles, or what about Paper Toss? This game app is oddly relaxing as it mimics the same ‘paper tossing’ you might try at work or school. Why not try your hand at Dentristry with fun, casual free app ‘Dentist office’. Or better yet, grow a virtual app that your parents won’t mind you bringing home! Farm lovers will appreciate fun app ‘Hay Day’ which takes you back to the ‘lay of the land’ where your job is to cultivate the farm! See what else we listed here and start playing!
-
These are the best rpg (Role Playing Games) available in the mobile market. We are personally obsessed with all things RPG so you can rest assured that we have tried and tested each of these game apps and not to mention provided our own personal reviews. Become your favorite characters as you take on all sorts of adventures in far off lands of wizards and dragons. You can also find ingenious multiplayer game apps such as Avatar Fight and Book of Heroes and the best iphone rpgs out there. Tons of fun, strategy and fantasy scenarios with other apps like Kingdom Conquest II and Dark Galaxy where you MUST win the battle for survival! Whether it be monsters, far off kingdoms or hobbits. These RPG games will have you coming back for more. There are many to choose from, what advice can we give you? Don’t get addicted – like we did! Plus, the best part is that they are all FREE to download.
-
The best free arcade games that you can play on your smartphone. Did you spend your youth in arcades playing video game classics like pinball or PacMan? Well no need to feel nostalgic, because here you will find an awesome variety of FREE Arcade app games for your smartphone! Tried searching iphone arcade or iphone arcade games? We have tried and reviewed each of these apps to only suggest the highest-rated and most fun apps. Games like ActionPotato and SonicDash - these games are guaranteed to give you an adrenaline burst as you navigate your way through various scenarios. Try Japanese made Capcom Arcade or drive fast in a world ravaged by Nuclear Annihilation, an action arcade game, Zombie Apocalypse and Alien Invasion in The Last Driver or what about Streaker Run -an exhilarating endless-runner game that will test your nerves and your reflexes! There are many arcade games to choose from so get out your phone and start downloading today!
-
Challenge yourself and your friends with the best action games for iphone in the mobile market! These games are not meant for the faint-of-heart. Instead if you are a true adrenaline junkie looking for a good action game - check out some of these apps for action! Battle it out with G.I. Joe on the battlefield or play Ironman 3 - the official game app from the famous movie. Sneak your way in, and shoot your way out with Contract Killer 2 or participate in the largest Allied Invasion in WWII with FrontLine Commando - D-Day. Or what about avoiding the jaws of the most famous and feared shark of all time, Jaws Revenge! Explore thug-life with cool free app - Big Time Gangsta. These are just a few among so many more! So many awesome options that you won’t ever get bored playing. All of these games have been tested and tried by our dedicated team of geek gamers!
-
A Las Vegas Casino has come to your smartphone with this collection of games meant to make you feel like you are on the betting floor of a real casino! If you are a fan of trying your luck with slot machines, we have a variety of free casino apps dedicated to just this! We have personally selected and tested each of these casino-themed apps and have only listed the best of the best! Roll your dice with ‘Dice with buddies free’! Or get down and dirty with a free bingo app Blingo Bingo and Bingo Beach - this is not your grandmother’s version of Bingo! Free Bingo apps are almost too fun! There are all sorts of high-stakes games to entice you to play against friends or even worldwide, who will come out with the winning deck? It could be you! Winning never was more fun with this collection of Free casino apps. We have so many apps here for you to enjoy!
-
Play to Win! Love collectible cards?These game apps will let you enter the best circles of card players from around the world. We have compiled, reviewed and tested this top list of competitive and fun various best trading cards games and you can be sure that we had a lot of fun doing so! Some of the apps include Boyaa Poker and Hearts! Free. Love classic but fun Solitaire? Download Solitaire City Lite which includes games like Spiderette and double klondike or Sorceress Free! Or enjoy many of our team’s favorite,Texas Poker, in a variety of different fun apps! You too can experience real life like blackjack with stunning graphics and smooth game-play with FREE virtual chips so that you can have a ton of fun without emptying your wallet. There are many casino card game apps to choose from. Just remember - what happens in the casino stays in the casino. Have fun winning!
-
Fun games to stimulate your brain. This list of brain training apps will have your cranium working like no other. Here you will find our top picks of awesome, challenging game apps that work as a memory trainer! Our team tried and reviewed each of these ‘brainy’ apps and here is out compiled list of favorites like Sudoku, Bejeweled blitz and the world’s best quiz game Quiz Cross. Get addicted with Bubble Mania - where you must defeat the evil bubble wizard and rescue baby critters. Ever heard of What’s Behind HD? If you love puzzles as much as we do, this is the game for you as you swipe away parts of the screen to reveal the mystery picture, a very cool brain app! To win you have to guess the picture faster than your friends Puzzles, quizzes and all sorts of mind-bending madness. these free ‘brainy’ game apps will wear you out faster than you can say “wazoo!’. Also keep an eye out for all of the other brain teaser apps we have listed here, there are many to choose from!
-
Experience the best of the best when it comes to the best ios sports games on your mobile with our top collection of sports-based games. We know you want only the best free sports games on the market which is why we wanted to find only the best highly-rated free sports games in the mobile market. We have tested these top game apps ourselves to make sure they were worthy of passing along to you. Get ready to go to the end zone with Big Win Football or kick butt with the best air hockey app with Touch Hockey 2. Are you a fan of darts? Why not play a super popular and 3D dart game called Darts 3D! Or go wild in the worlds of Frisbee with Frisbee Forever! With Baseball superstars 2013 - you can participate in the ultimate smart baseball experience! We also have many more sports game apps to choose from so start downloading!
-
Here you will find thebest Trading Card Games that you can install and play for free. Collect beautiful cards and wield your power while trading them in our list of top trading card games or Trading Card game apps. Our dedicated gamer team has searched far and wide for only the top TCG games for this catalog and we have tested and personally tried every single game here. What kind of apps do we have listed here? Some include Spellstorm, which has you take powerful cards with cool graphics to battle players from all over the world. Or why not become the most powerful Darklord with Darklord Legends - where you can collect over 125 different cards! Let the power lie in your hands with Duel of Fate game app. Or, uncover the mysteries of Deity Wars. All for free and you can download any of them today!
-
Fun educational apps for both kids and adults. This is our collection of game apps that collide with education. Yes you can actually learn and have fun at the same time; in fact you won’t even feel like you are learning! Compiled here are some great educational game apps for kids and education which our team has tried and played before adding them to this list. We are very diligent on which apps we select and only pick those that we find to be easy to use and fun! We know education is important to you which is why we added this category to our database. You will find all sorts of different game apps for a wide range of ages, from toddlers to adults. There is something for everyone! Keep your eye out for updated and added free educational apps as we will try to keep this list current and fresh! Start the path towards entertainment and learning today!
-
-


Graph
Graph is straightforward: • Makes graphs from numbers. • Made by the data visualization expert - VVI®. • Touch...
Free

Store review
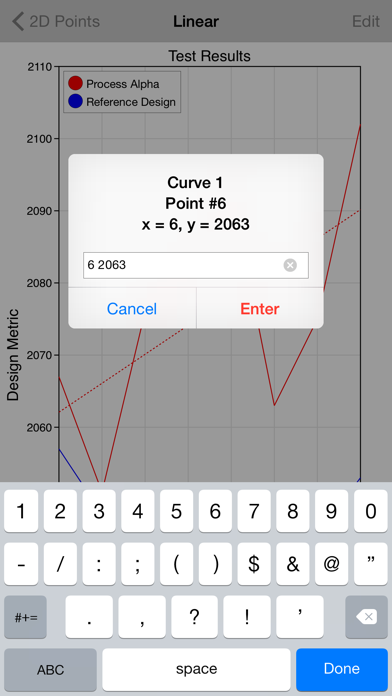
Graph is straightforward:
• Makes graphs from numbers.
• Made by the data visualization expert - VVI®.
• Touch-hold a graph to email, print or save to your Photo Album.
• Plenty of built-in options.
• AirDrop your graph to the most powerful data visualization application on the iPad, Graph IDE.
FEATURES
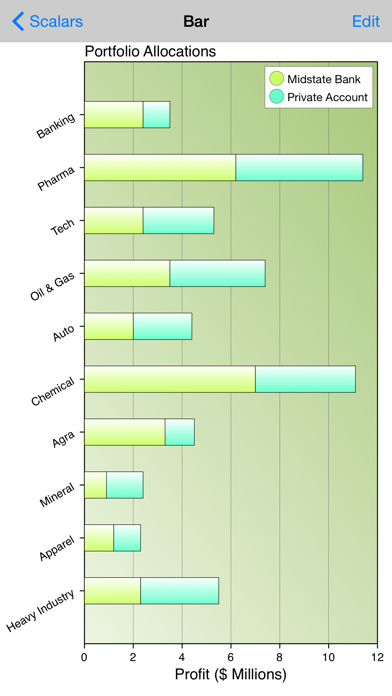
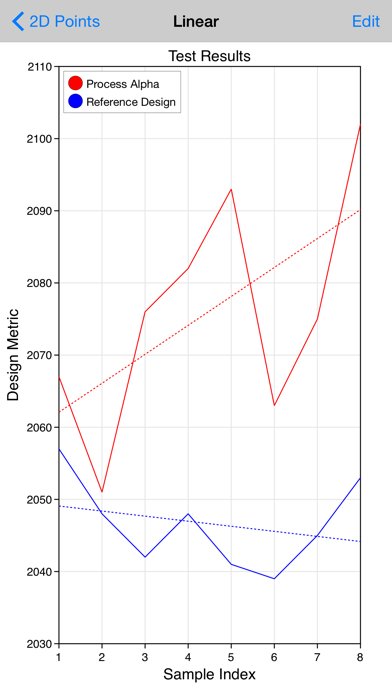
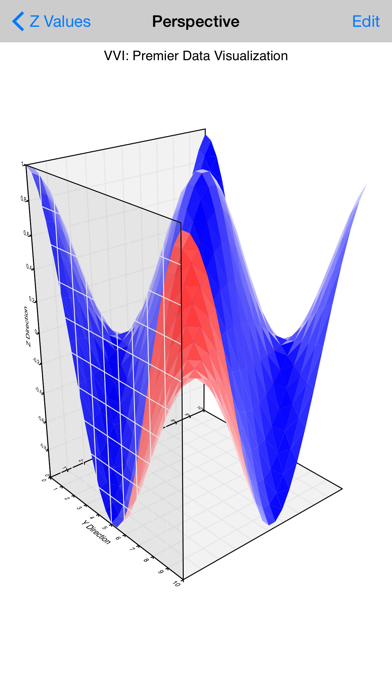
• Includes several 1D, 2D and 3D graph types such as bar, column, pie, line, area, scatter, 3D perspective scatter, trajectory and surface, volumetric, z-sliced cell, maps, linear, semi-log, x-log, log-log, polar, r-log, Gregorian date and many variations.
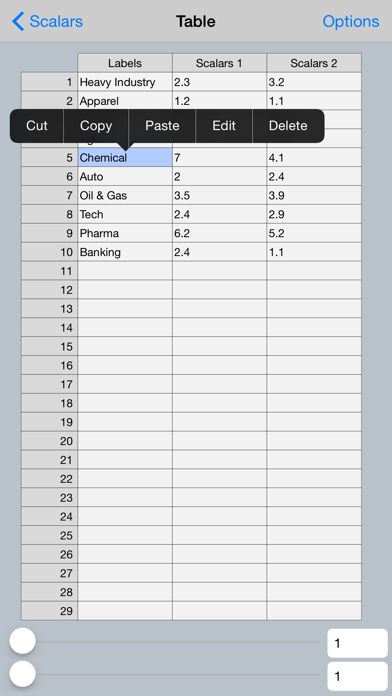
• Data is pasted from the pasteboard and inserted and edited using a table interface.
• Touch-hold a graph to export it to Graph IDE on the iPad. Graph IDE is the most powerful data visualization application for the iPad and gives access to a wide variety of graph types and graphical effects. (Graph IDE is separately available for the iPad).
• Touch graphs to rotate, zoom, scroll and scan data.
• Touch data graphics, such as lines and bars, to show data values.
• Touch-hold a graph to copy, print, mail, AirDrop and save it to other applications.
• Data and preferences are organized by project and each project is persistent and automatically saved so you can show and retrieve your settings and data on subsequent use.
NOTE: Continued use of GPS running in the background can dramatically decrease battery life. The Location Tracking task requires GPS for its function.
ADD-ON
The in-app purchase enables the Least Squares, Error Bars, Location Tracking, Weight and Health tasks and removes ads.
Store rating
3
out of
11 reviews
Size
43.4 MB
Last update
June 30, 2020
 Facebook
 Twitter
 Google plus